Showing posts with label bigquery. Show all posts

Thursday, 26 September 2013

Visualizing airport delay correlations with Google BigQuery and Maps API

Author PhotoBy Josh Livni, Maps Developer Relations Team

Cross-posted with the Google Geo Developers Blog

Last week Felipe and Michael from the Google Cloud Platform Developer Relations team released a video demonstrating the new Pearson correlation analysis available in Google BigQuery. Their example used more than 70 million flight records to find correlations on departure times, which could be used to predict whether your plane would be late. Specifically, you can find out which set of airports best predict your airport’s possible flight delays the following day.

As you can see from their code (watch the video for context), they’re using iPython Notebook to work with the BigQuery results, and matplotlib to get a quick visual of results. But one aspect that’s hard to see in these results is the spatial relationship of the airports. Maps to the rescue!

My goal was to create a simple visualization, where selecting any airport would highlight which airports you should look at to predict delays the next day. Using the Google Maps JavaScript API I went ahead and did just that:
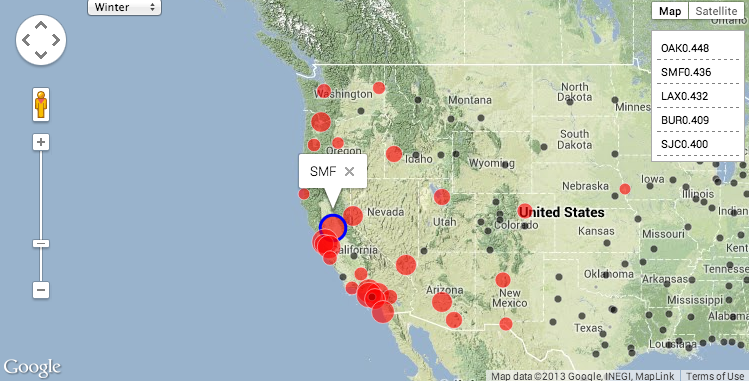


To create this map, using the same code noted above, we first created a JSON dump of the correlations on departure time for each airport to each other airport. Then, using an article on visualizing earthquakes as a template, I modified the code so that we have a simple dictionary of all airports, keyed by their airport id. Last but not least, I added a function that gets called when an airport marker is clicked in order to restyle all the other airport markers according to their correlation. This method checks the selected season (winter, for example, has different correlations than spring), and highlights correlated markers by setting the color and scale of the circle symbol.


Thanks to BigQuery, running complex correlations over billions or trillions of attributes is surprisingly easy. But don’t forget if your data does have some spatial component, a quick mapping visual can add some great context to your results.


Josh Livni works with maps at Google, where he helps developers tell compelling stories using the Google Maps APIs. As you read this, he's probably writing code, thinking about snowboarding, or both.

Posted by Scott Knaster, Editor

Wednesday, 18 September 2013

Google BigQuery goes real-time with streaming inserts, time-based queries, and more

Author PhotoBy Felipe Hoffa, Developer Programs Engineer

Cross-posted from the Google Cloud Platform Blog

Google BigQuery is designed to make it easy to analyze large amounts of data quickly. This year we've seen great updates: big scale JOINs and GROUP BYs, unlimited result sizes, smarter functions, bigger quotas, as well as multiple improvements to the web UI. Today we've gone even further, announcing several updates that give BigQuery the ability to work in real-time, query subsets of the latest data, more functions and browser tool improvements.

Real-time analytics
BigQuery is now able to load and analyze data in real time through a simple API call, the new tabledata().insertAll() endpoint. This enables you to store data as it comes in, rather than building and maintaining systems just to cache and upload in batches. The best part? The new data is available for querying instantaneously. This feature is great for time sensitive use cases like log analysis and alerts generation.

Using it is as easy as calling the new endpoint with your data in a JSON object (with a single row or multiple rows of data).

Here's a Python example:
body = {"rows":[
{"json": {"column_name":7.7,}}
]}
response = bigquery.tabledata().insertAll(
projectId=PROJECT_ID,
datasetId=DATASET_ID,
tableId=TABLE_ID,
body=body).execute()

Streaming data into BigQuery is free for an introductory period until January 1st, 2014. After that it will be billed at a flat rate of 1 cent per 10,000 rows inserted. The traditional jobs().insert() method will continue to be free. When choosing which import method to use, check for the one that best matches your use case. Keep using the jobs().insert() endpoint for bulk and big data loading. Switch to the new tabledata().insertAll() endpoint if your use case calls for a constantly and instantly updating stream of data.

Table decorators for recent imported data
This release introduces a new syntax for "table decorators". Now you can define queries that only scan a range or spot in the previous 24 hours. Traditionally BigQuery has always done a "full column scan" when querying data, while the new syntax will allow you to focus only on a specific subset of the latest data. Querying a partial subset of data with these decorators will result in lower querying costs — proportional to the size of the subset of the queried data.

With the new capabilities you can query only the last hour of inserted data, or query only what was inserted before that hour, or get a snapshot of the table at a specific time. The table decorators also work in all table related operations (list, export, copy, and so on), giving you the ability to do operations like copying a table as it was before a bad import job.

New window and statistical functions
To the previously announced window functions, we've added SUM(), COUNT(), AVG(), MIN(), MAX(), FIRST_VALUE, and LAST_VALUE(). Refer to the previous release announcement for a run through of how window functions work.

We also recently introduced the new Pearson correlation function, and showed how to find interesting and anomalous patterns in ambient sensors, or how to predict tomorrow's flight delays using 70 million flights dataset. Today's release adds new statistical functions, for even richer capabilities: COVAR_POP(), COVAR_SAMP(), STDDEV_POP(), STDDEV_SAMP(), VAR_POP() and VAR_SAMP().

BigQuery browser tool: Improved history retrieval
You can now query your history faster in the browser tool using the Query History panel: More information about the queries is being surfaced and convenient buttons have been added for common tasks.

You can try out the new UI features, table decorators, and new functions at https://bigquery.cloud.google.com/. You can post questions and get quick answers about BigQuery usage and development on Stack Overflow. We love your feedback and comments. Join the discussion on +Google Cloud Platform using the hashtag #BigQuery.


Felipe Hoffa is part of the Cloud Platform team. He'd love to see the world's data accessible for everyone in BigQuery.

Posted by Scott Knaster, Editor